Now What?
Now that FleetDM and the necessary ElasticStack components are up and running, what’s next? This post guides you through three example steps to dive into some useful functionality of this system.
- Establish a Basic Endpoint Security Baseline: Deploy queries to audit and implement basic security controls on your endpoints.
- View osquery Logs in Elastic Kibana: Schedule queries, send results to Elasticsearch, and create a Kibana dashboard for better visibility.
- Identify Risky Browser Extensions: Write a scheduled query to detect risky browser extensions and build a related detection in Kibana.
Part 1: Endpoint Security Baseline
A quick win is to deploy queries that audit endpoint security controls. Even without administrative or operational control over end-user devices, you can implement and audit a basic set of endpoint security controls to significantly reduce the risk of compromise. These queries can be set up as scheduled queries with a corresponding dashboard in Kibana or implemented using FleetDM’s Policy functionality.
Example: Key Controls
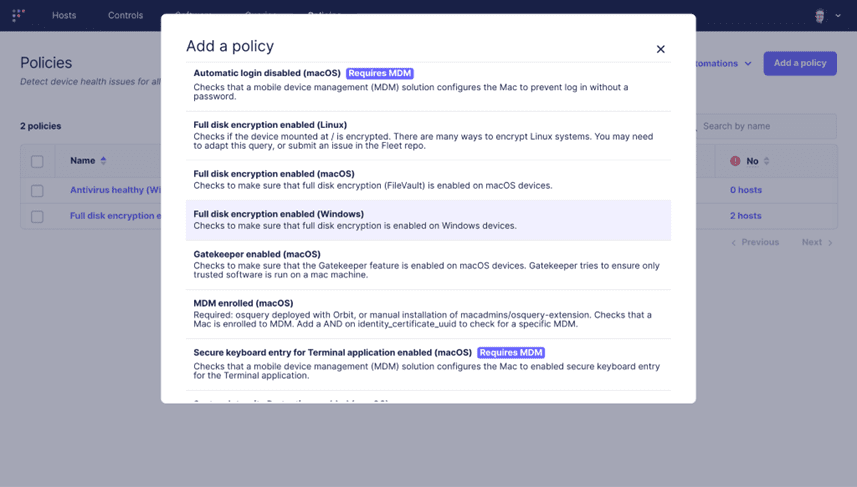
For example, here is how we could implement the following key controls with FleetDM policies:
- Full-Disk Encryption (FDE) Enabled for OS drive
- Using FDE reduces the risk of data compromise due to lost or stolen devices.
FleetDM has an existing policy for checking if full disk encryption is enabled on macOS, Windows, and Linux.
- System is running a non-EOL OS
- Non-end of life (EOL) means that there are regular security updates released for the OS, which protects the system from vulnerabilities.
- The following query is for macOS:
- — This query checks if the macOS version is non-EOL based on major version numbers.
- — Last updated: 2024-04-20
- — Source: End of life data for macOS versions sourced from https://endoflife.date/macos
- SELECT 1 AS status
- FROM os_version
- WHERE major >= 12; — Monterey (12) and newer versions are considered supported as of the last update.
Further reading:
- FleetDM Policies: https://fleetdm.com/securing/what-are-fleet-policies
Part 2: Elastic Kibana Quickstart
In this section, we will schedule a query, send its results to Elasticsearch, and import a Kibana Dashboard to view the scheduled query results.
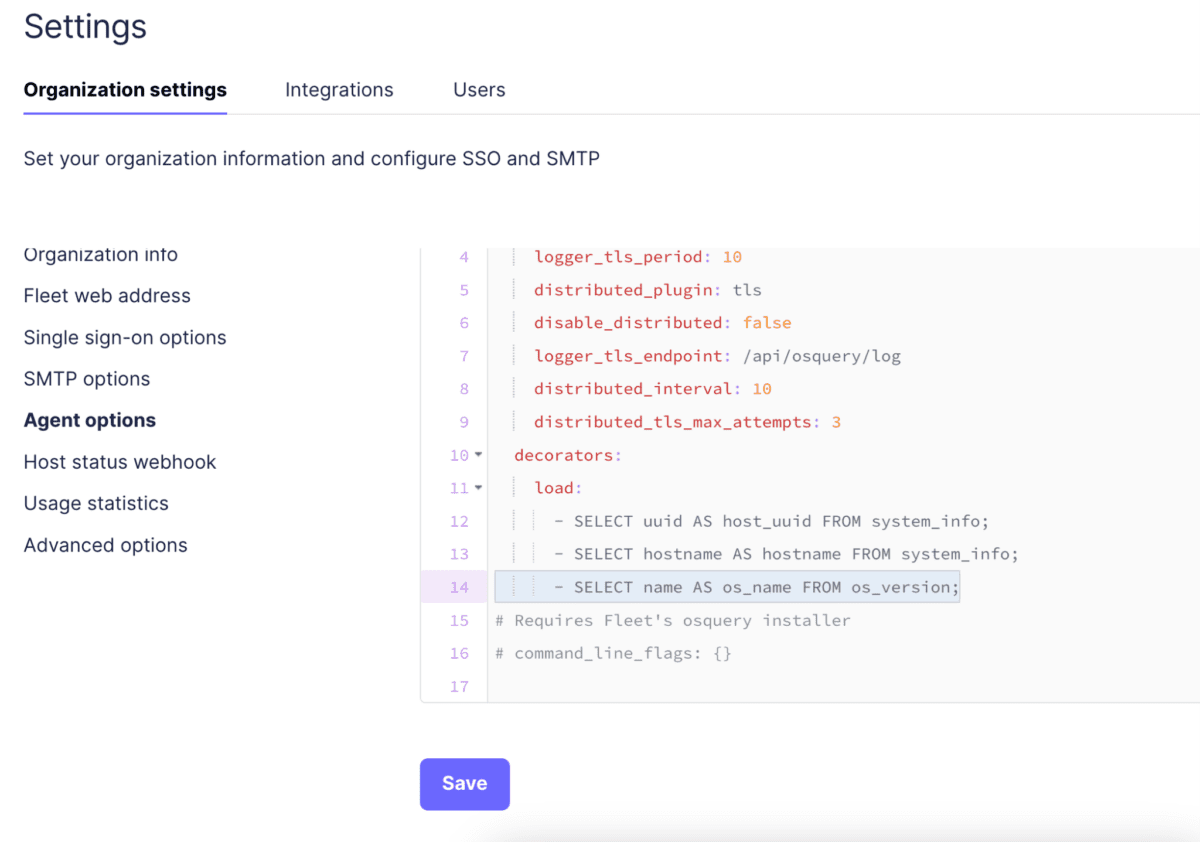
But first, let’s start with modifying the default decorator queries. These are queries that are run with every scheduled query and their results attached to the scheduled queries’ results. We want to add one that will attach the OS name to every schedule query result – this will be useful for the dashboard later.
Decorator Queries
- Log in to FleetDM
- Navigate to Settings –> Organization Settings –> Agent Options
- Add the query `SELECT name AS os_name FROM os_version;` to the YAML section under decorators.load, then save the configuration
Scheduling a Query
Next up, let’s schedule a query and send its results to Elasticsearch, so that we can view it in Kibana.
- Navigate to the Query Section
- Go to Queries –> Add Query within FleetDM.
- Enter the Query
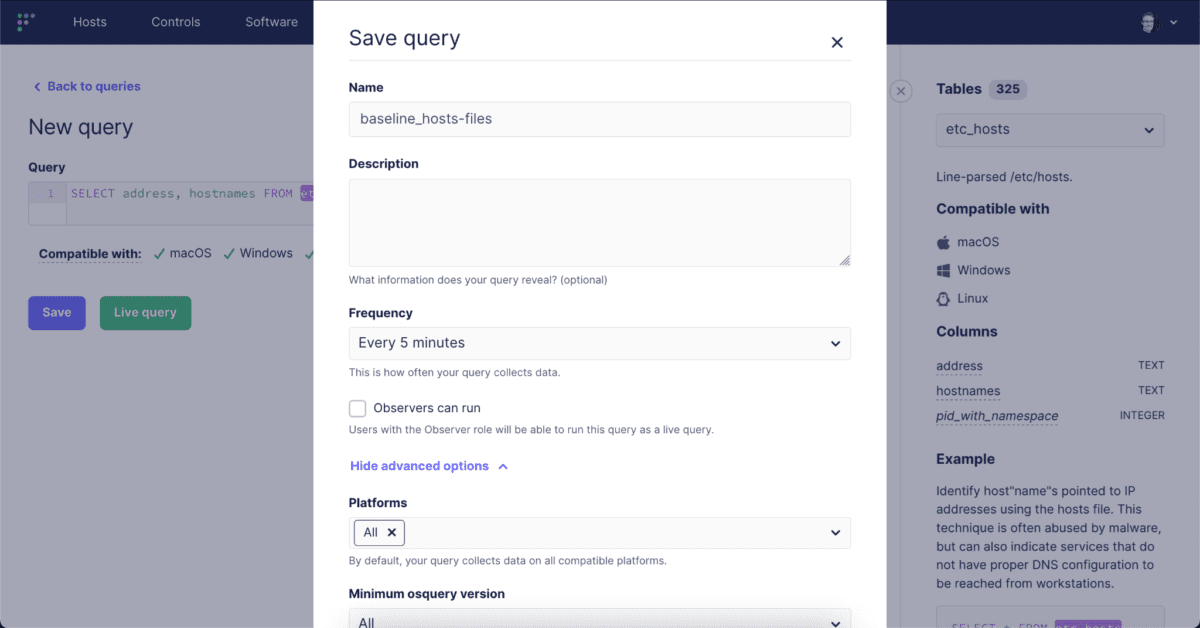
- In the “Query” input field, enter the SQL query `SELECT address, hostnames FROM etc_hosts;`
This query retrieves all the host to IP mappings from the local hosts file on a system. This information is valuable for identifying potential malware targets, as the hosts file can be manipulated by malicious software.
Note on SQL best practices: Specify Columns Explicitly
It’s recommended to specify the columns you want to query rather than using *, which selects all columns. This approach provides a known static dataset, which is useful if the table is modified in the future and additional columns are added.
Additional Resources
If you are unsure about the columns in a table, you can find this information on the right-hand side under “Tables” or by referring to osquery’s documentation.
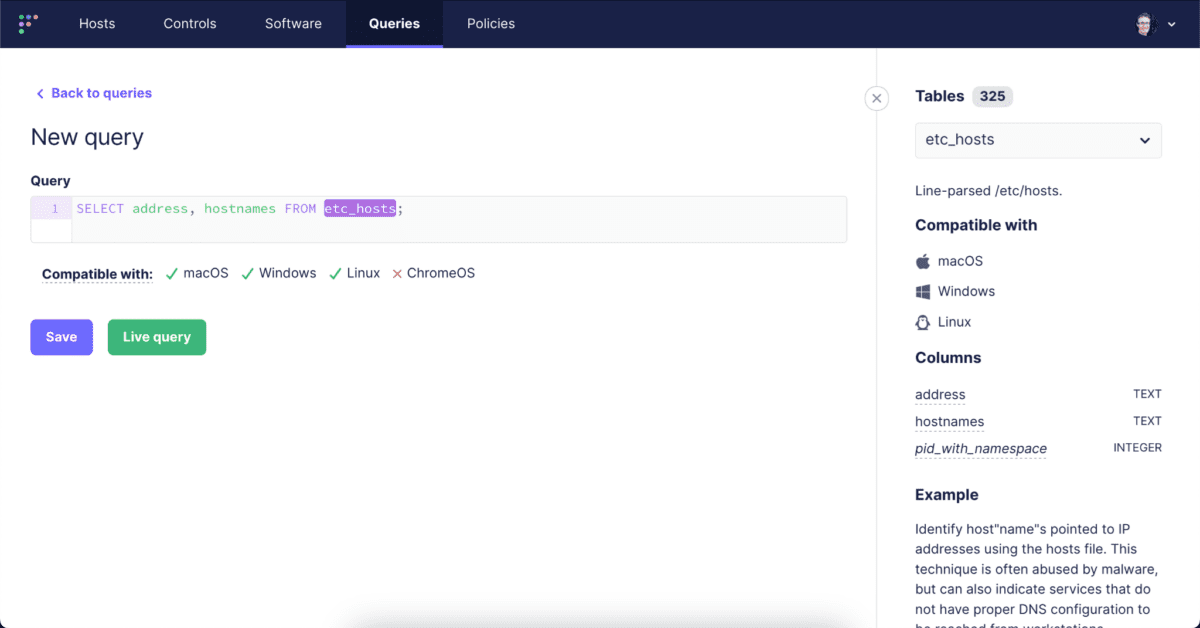
Let’s run a Live Query to confirm that it works as expected.
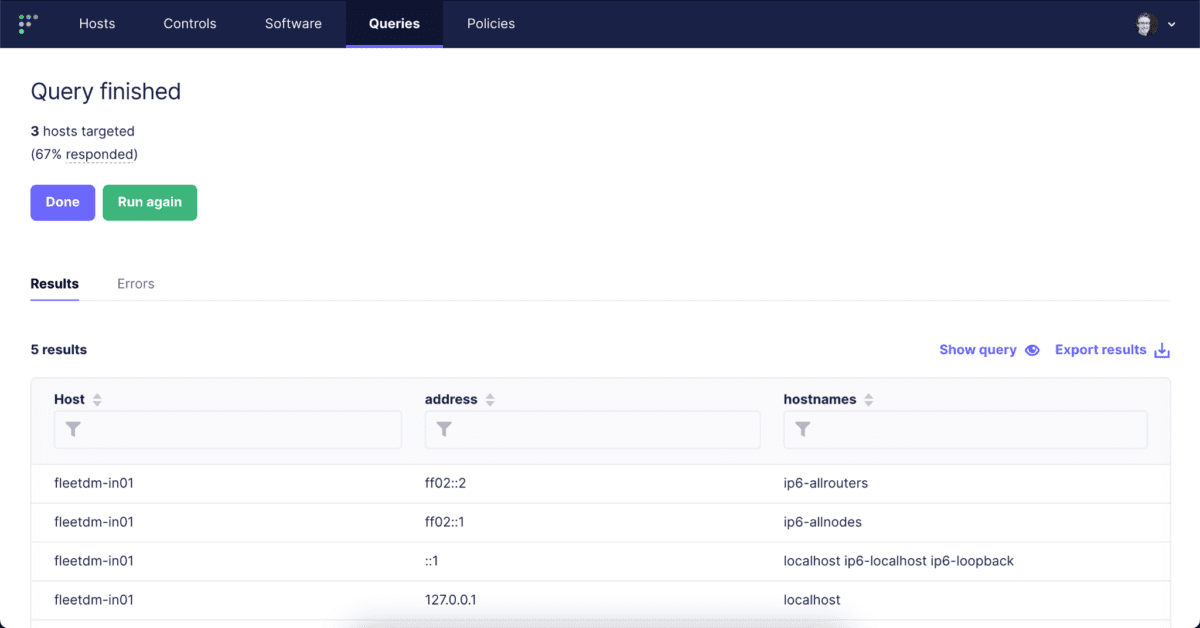
Looks good! Click “Done” and then “Save” and give it a name, then set it to run every 5 minutes, and most importantly, set it to snapshot logging. This will return all the results from the hosts file every 5 minutes.
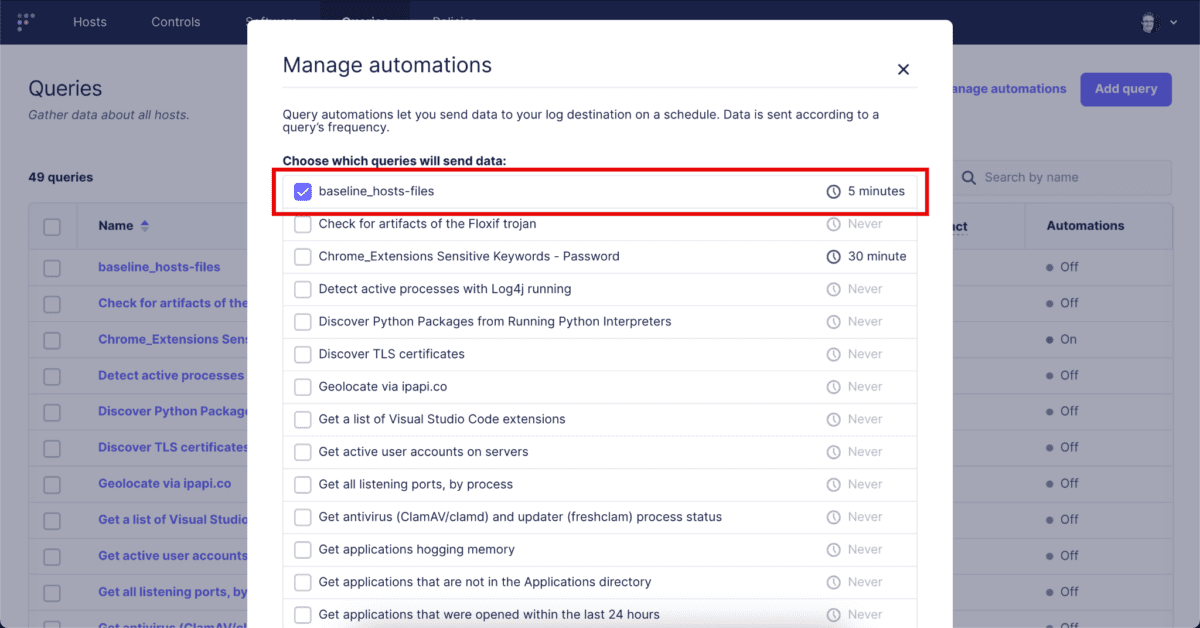
With the query scheduled, now we have to configure it to send its logs to Elasticsearch. We can do that by navigating to Policies –> Manage Automations and selecting our newly saved query and then clicking “Save.”
With that completed, let’s move on to Kibana.
Importing Kibana Dashboards
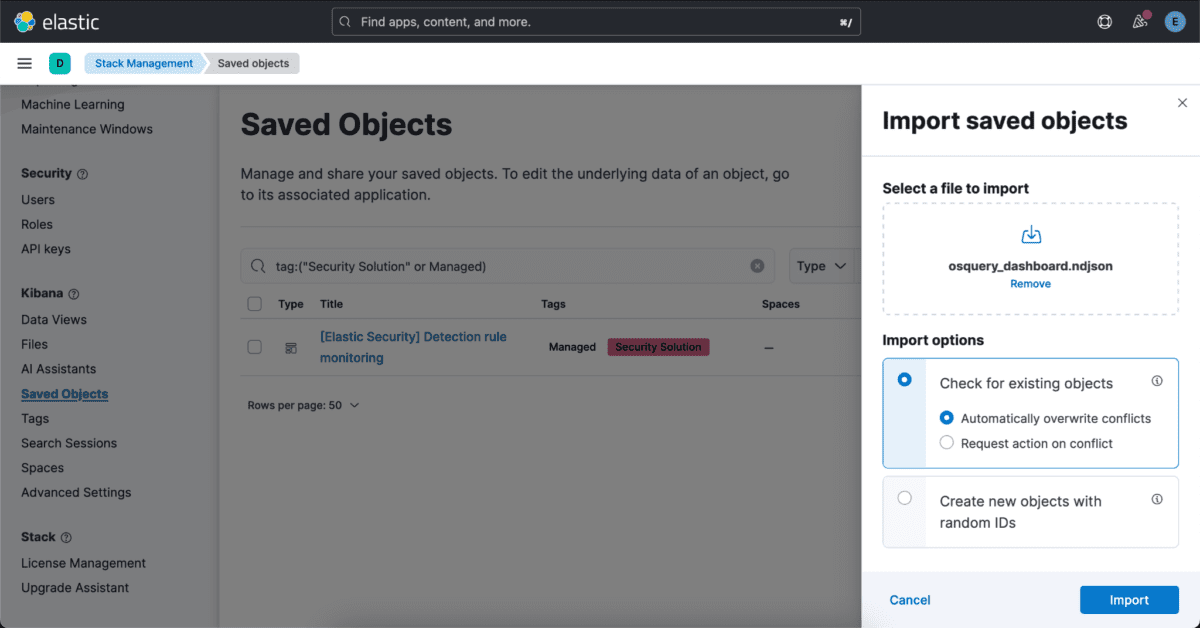
First off, let’s import the previously created dashboard, which you can find here. To do this, navigate to: Management –> Stack Management –> Kibana/Saved Objects –> Import.
Select the file, leave the import settings as is, and select “Import.”
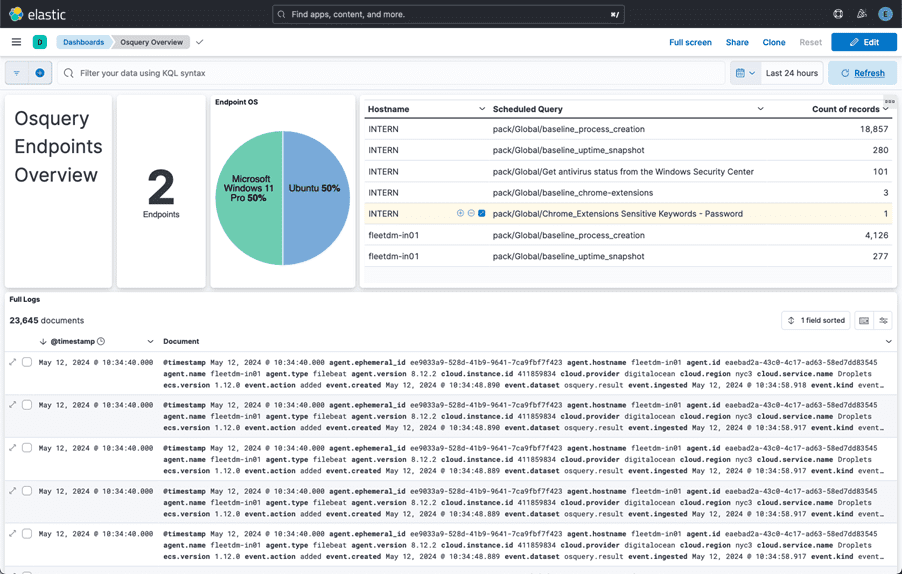
You should now be able to navigate to Analytics –> Dashboards –> Osquery Overview.
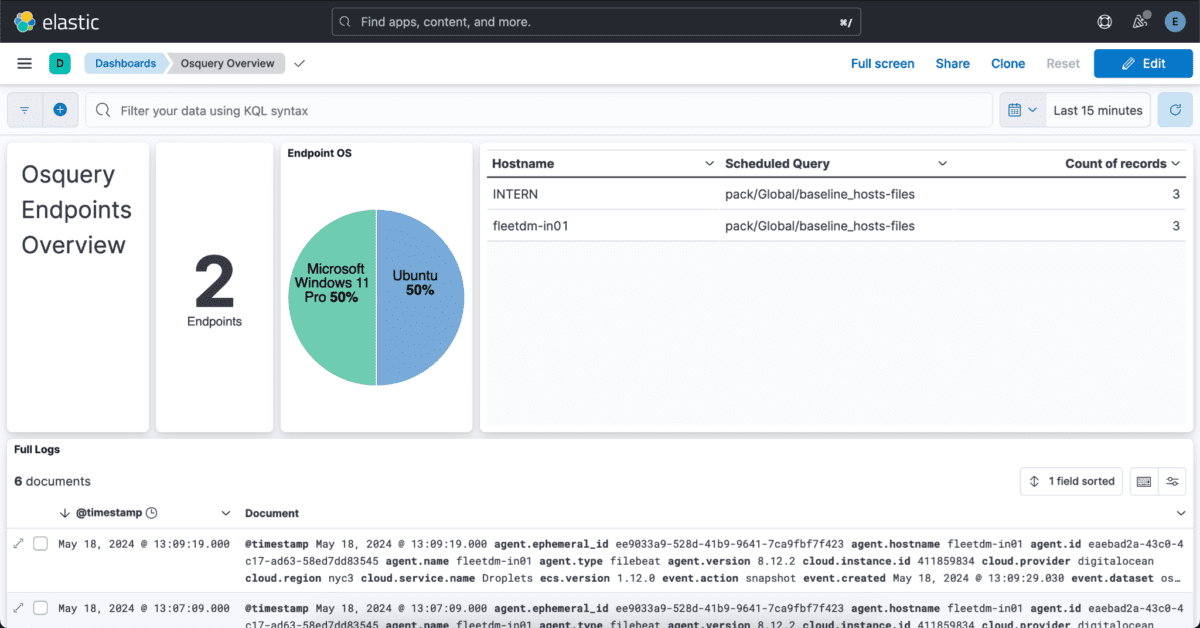
Key Features of the Dashboard
- Data Filtering
- You can filter the dashboard to view specific results, focusing on particular data points or time frames.
- Log Viewing
- The bottom section of the dashboard allows you to view individual logs, providing detailed insights into each entry.
Example Use Cases
Dashboards can be tailored for specific use cases. For instance, you may create a dashboard that:
- Displays all recently created users in the organization.
- Includes details such as usernames, group memberships, and whether they have administrative privileges.
By customizing dashboards to your needs, you can quickly access and analyze the most relevant data for your organization.
Part 3 – Scenario: Identifying Risky Browser Extensions
Let’s move on to creating a more intentional detection. Browser extensions are an area of significant risk, as they can have full access to all data sent and received in your web browser. Considering how people are targeted, this is an area we would want visibility into.
Why Monitor Browser Extensions?
- Risk Factor: Browser extensions can obtain full read/write access to the contents of pages as well as user-submitted data such as passwords.
- Visibility: By monitoring these extensions, you can gain insights into potential security risks.
Fortunately, osquery provides a table that offers excellent visibility into browser extensions: the chrome_extensions table. You can find more details here: chrome_extensions table. Despite the name “chrome,” this table pulls extension information from all Chromium-based browsers, including Chrome, Edge, Brave, and Yandex.
Developing the query
One typical workflow for developing new queries is to develop and test it locally using osqueryi, then test running it through osquery Fleet management infrastructure. Osqueryi is the same binary as osqueryd (the osquery daemon), but it runs an interactive shell that allows us to run queries locally. You can install it using the installers available at osquery downloads.
Initial Query
To start, run the following query to get basic information about browser extensions:
SELECT uid, browser_type, name, identifier FROM chrome_extensions;

Note: “The chrome_extensions table returns data based on the current user by default, consider JOINing against the users table”
Expanding the Query for All Users
To get all the chrome extensions for all users on the system, we need to join the chrome_extensions table with the users table. There is some nuance for how we have to do that, which is covered in this blog post: https://fleetdm.com/guides/osquery-consider-joining-against-the-users-table
The upshot is that we need to use a CROSS JOIN. Modifying the query and running it on our local system loads the results we would expect to see:
- SELECT u.uid, u.username, ce.browser_type, ce.name, ce.identifier
- FROM users u
- CROSS JOIN chrome_extensions ce USING (uid);
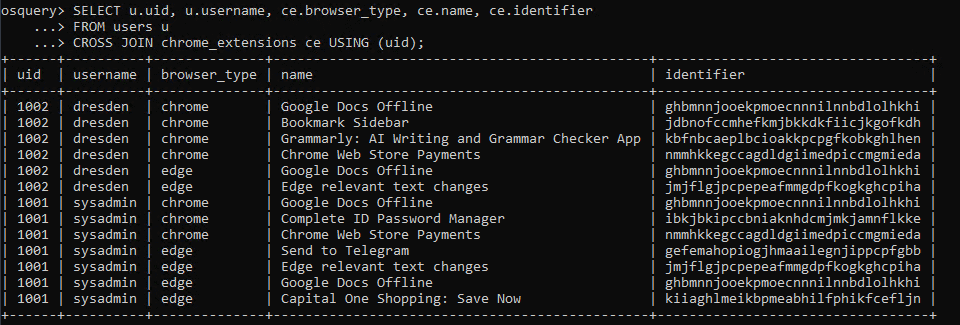
From here, we have two options for our detection: pull these results into Elasticsearch and build the detection logic within the Elastic SIEM Query Language, or have our osquery query handle this logic for us.
Using Elasticsearch and Elastic SIEM Query Language
- Option: Pull the query results into Elasticsearch and build the detection logic using the Elastic SIEM Query Language.
- Advantage: This method allows for more complex analysis and integration within the Elastic stack.
Building Detection Logic into the osquery Query
- Option: Incorporate the detection logic directly within the osquery query.
- Advantage: This approach simplifies the process by handling detection at the query level, without needing to set up additional infrastructure.
For simplicity in our current scenario, we’ll build the detection logic directly into our osquery query. We want this query to return results only if there are extensions with specific keywords in their name or description, such as “password.” Let’s add this filter to the query.
Note on Using AI Tools
We have had good success using ChatGPT to help generate and edit queries. It’s important to note that you shouldn’t enter sensitive information into ChatGPT or any non-local LLM, and be aware that it can make mistakes.
Running that query on our system renders expected results.

Adding a Custom Column for Unique Identification
One final edit: add a custom column with a unique identifier as the value. This will make it very simple to write a detection in Kibana for it when we get to that step. Here is what that will look like:
- SELECT u.uid, u.username, ce.browser_type, ce.name, ce.identifier, “browser_ext-password” as query_id
- FROM users u
- CROSS JOIN chrome_extensions ce USING (uid)
- WHERE ce.name LIKE ‘%password%’ OR ce.description LIKE ‘%password%’;
- The query_id column is set to a unique identifier value “browser_ext-password“. This identifier helps to easily filter and identify results related to this specific query in Kibana.
- The USING (uid) clause ensures the correct joining of users and chrome_extensions tables based on the user ID.
Now that we have our query ready to go, let’s go back to FleetDM and schedule it.
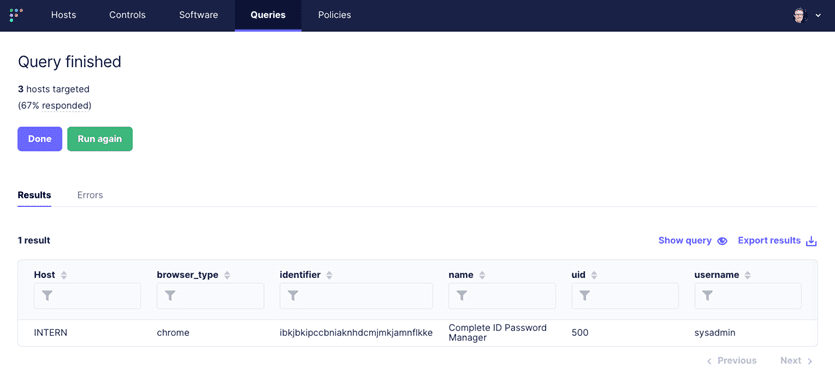
Start by running it as a Live Query to confirm it is working:
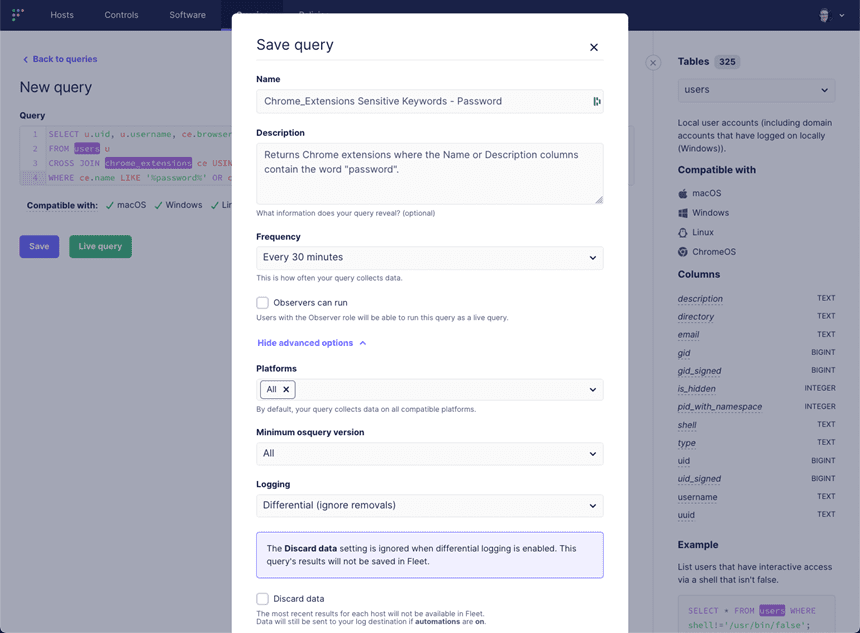
Now, schedule it to run every 30 minutes and to log the results in differential mode, which means once the initial query is complete only newly installed extension information will be sent.
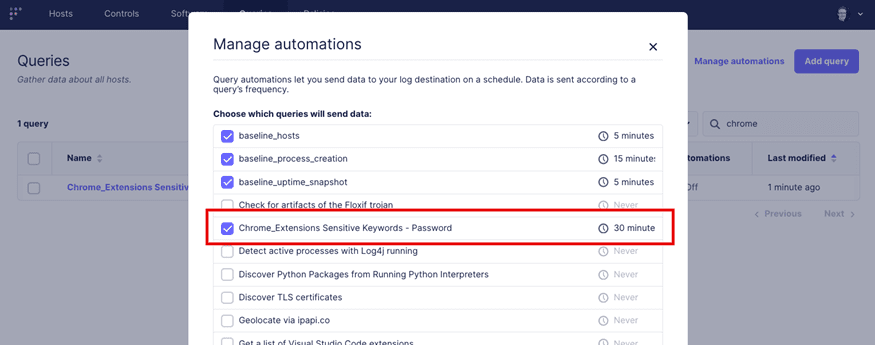
Once it is saved, we need to go to “Manage Automations” and configure it to send its results to Elasticsearch:
Let’s give it about 10 minutes and then pull up the dashboard – we should see the results of our scheduled query:
Writing the Detection
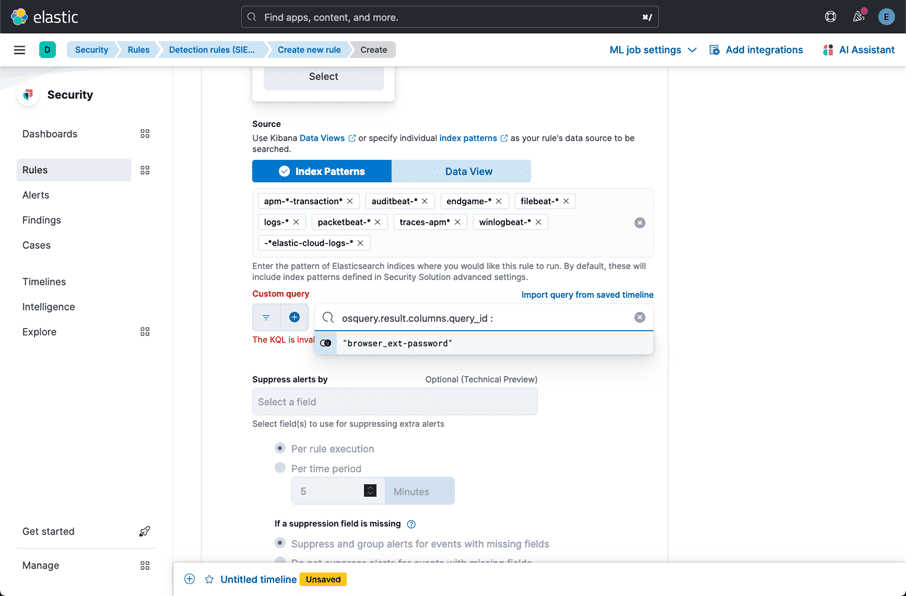
Now let’s build out a Detection Rule to alert us when a new “password” related extension is installed. We can do this by navigating in Kibana to Security –> Rules –> Detection Rules (SIEM), and then in the upper right hand corner “Create New Rule”.
There are number of ways to write this detection, but one of the simplest is to select “Custom Query” and then select the “query_id” field and the id that we previously configured:
osquery.result.columns.query_id : “browser_ext-password”
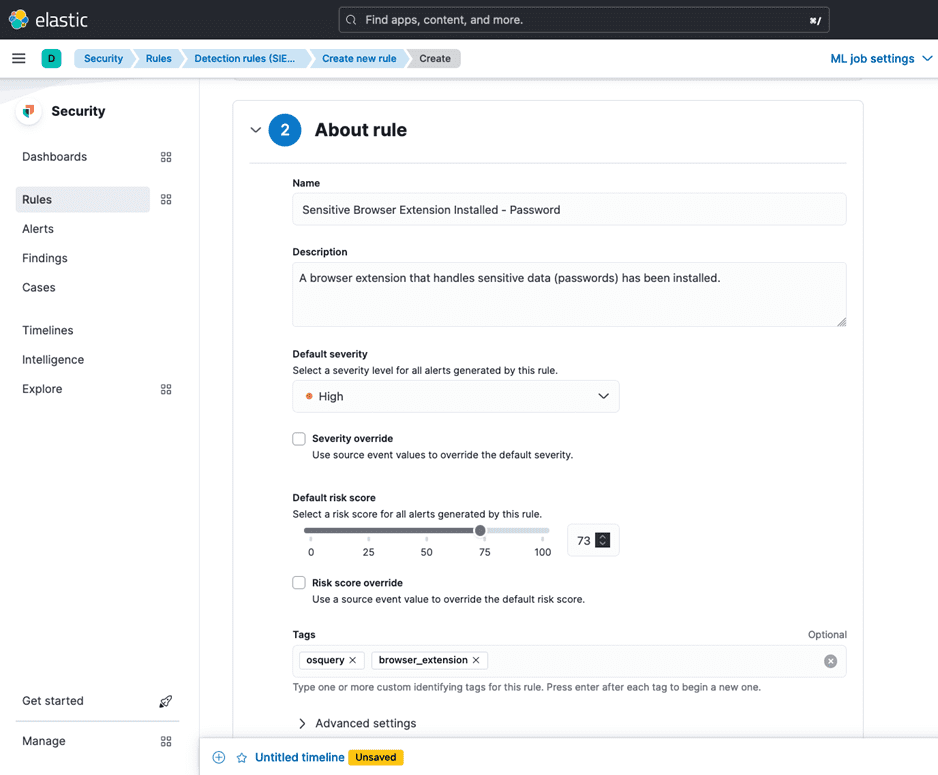
After configuring the query, complete any additional required fields, such as rule name, severity, and response actions. Save the rule to activate it.
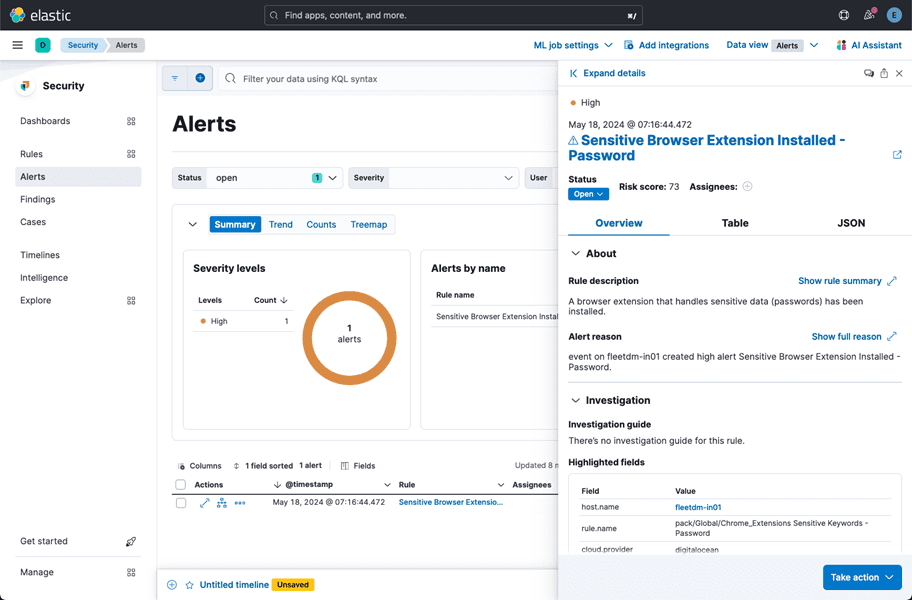
With this done, anytime there is a log with “password” in the field or value, an alert will be generated.
Next we need to fill out some metadata about the rule.
Finally we set a schedule for it and select the option to Create and Enable it.
We can test the rule by installing a password-related browser extension and confirming that the alert showed up.
Next Steps
These are three examples demonstrating how you can effectively use FleetDM and ElasticStack to more effectively gain insight and identify threats or attacks on machines in your organization. From here, there are numerous directions you can take.
You could expand on the endpoint audit queries to check on installed software, running processes, or system configurations. Some packages of queries can help with threat hunting, such as those in the osquery defense kit. It is also possible to automate sending of system logs, like Windows Event Logs, to Elasticsearch, which would allow the use of pre-built detections from Elastic or the Sigma project, obtaining advanced threat detection capabilities and reducing the time required to develop your own rules.
While these approaches require increasingly sophisticated capabilities, by building on the skills shared in these blog posts, you can explore these robust abilities to support your and other organizations to mount a robust defense and investigative capability while leveraging open source software.
This post was written by Josh Brower with contributions from Neil Blazevic, Martijn Grooten, Joey Salazar, Marc Shaffer, and Ashley Fowler.