Civil society groups and independent media organizations play a crucial role in fostering transparency and accountability as watchdogs, advocates, and informants. However, their work exposes members of these groups and organizations to numerous digital threats like malware, account hacks, surveillance, tracking, and intimidation. Adversaries often target their devices to monitor activities, track movements, or disrupt operations.
As these organizations and groups grow, the complexity of managing and securing an increasing number of staff devices also escalates. The task of continuously investigating and monitoring end-user devices (in this context also known as hosts or endpoints) for potential security issues can become overwhelmingly complex without the right tools. Many industry-standard security solutions, such as Endpoint Detection and Response (EDR) and mobile device management (MDM), are costly and proprietary – barriers that can exclude non-profits with limited budgets.
To address this challenge, Internews and partners launched the INSIGHTFUL project to review open source “blue-team tools” which can be used for defensive and investigative purposes against digital threats. They range from individual-use software to more elaborate, scalable solutions for large teams.
This post introduces two of the tools used in INSIGHTFUL, osquery and FleetDM, and their essential features. We’ll share a newly-developed guide to launch FleetDM with a log-collector infrastructure on a single machine and provide a walkthrough of its features. A follow-up post will explore additional features and capabilities of osquery and FleetDM.
While we are not specifically endorsing either of these tools, and there are tangible privacy and security trade-offs and risks when organizations adopt more aggressive device management/visibility strategies, we aim to educate readers on how similar product approaches could benefit individuals and organizations in vulnerable sectors.
Osquery & FleetDM
Osquery is an open-source tool that allows users to query (request information from) a device’s operating system (OS), using a syntax like those used when querying databases, to gather information about its state and data. This provides a powerful means to investigate and analyze system data, offering crucial insights into security vulnerabilities or compromises. Osquery offers detailed insights into a device’s system configuration, processes, and security events, enabling administrators to inspect devices (endpoints) for OS data, changes, security discrepancies, compliance, hardware changes, and more.
FleetDM is an open-source platform designed to distribute and manage osquery agents across a group of devices (the ‘fleet’) and to interact with information received from these agents. FleetDM provides a high level of visibility into an organization’s devices’ security status and enables advanced methods to search for vulnerabilities or identify compromises within an organization.
Key Features of FleetDM
The hosts dashboard lists critical information regarding all devices (endpoints) hosting the FleetDM agent across your organization.

Selecting a single device reveals useful information, such as OS version and disk encryption status, relevant to improving your organization’s security baseline.

FleetDM includes useful policies to check the status and compliance of devices with your security goals. These policies are not enforced on the endpoint (although some additional MDM features can be configured on FleetDM) but are used to check the pass/fail status of each endpoint hosting the FleetDM agent. You can also create new policies utilizing osquery syntax.

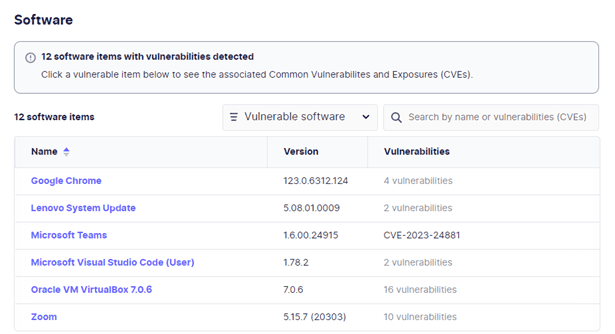
Software inventory from each device includes vulnerability data on unpatched packages installed, which can be used to improve endpoint owners’ patching and vulnerability management.
FleetDM also allows you to run live queries against active hosts using your own custom-written queries or an optional, installable pack of standard queries.

Unlocking the Potential of FleetDM with a Single-Server Deployment with Logging
These features are already extremely useful for monitoring organizational devices. However, to unlock the full power of osquery, adapt it to your organization’s needs, and carry out targeted threat hunting activities within your fleet, you’ll need to set up the functionality to retain, view, or search logs from scheduled queries. This requires additional infrastructure to receive, access, investigate, and monitor log results.
Larger-scale users of FleetDM will likely run their own logging servers or use cloud service providers such as AWS or GCP with tools such as Kinesis and Pub/Sub for dedicated data ingestion. However, this adds extra costs and assumes higher requirements than most small/medium organizations can meet.
To provide a cost-effective solution, we worked with Defensive Depth to compile a Technical Installation Guide for a self-contained single server deployment of FleetDM and necessary Elastic Stack components. This deployment model is ideal for smaller organizations, offering a cost-effective and efficient solution that gives needed visibility without requiring extensive infrastructure.
The Deployment Guide walks you through:
- Installing FleetDM and all dependencies on an Ubuntu server (instructions should work on Debian servers as well).
- Installing Elasticsearch, Kibana, and Filebeat (the components needed to receive, process, and investigate osquery logs) and direct logs to them.
- Installing fleetctl utility and loading the FleetDM Standard Query library.
- Generating agents for your endpoints.
- Accessing a basic dashboard for your queries in Kibana.
In our testing, we have all elements installed and running on an Ubuntu 22.04 VPS with 4 CPU cores and 8GB of RAM and 120GB disk space. We estimate that with a moderate amount of logging this setup can support over 100 host devices. At current VPS rates this provides a solution to organizations at a cost of about $50-60 a month, though smaller deployments are likely possible.
Seeing it in Action
Let’s take an example use case: Browser extensions are a unique source of risk, as they may have access to all data flowing through the browser and are often used in sensitive cases, such as password or secure communications app management.
To manage this risk, we can first build a query in FleetDM to list all the Chromium-based browser extensions for all users on a system.
Steps to Build and Run the Query:
- Build the Query:
- Construct a query in FleetDM to list all Chromium-based browser extensions.
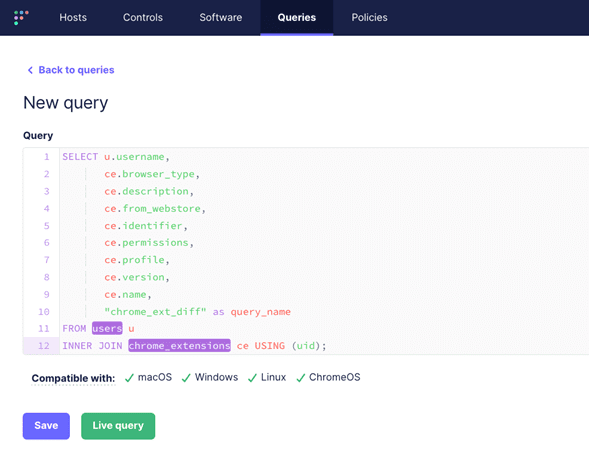
- Run a Live Query:
- Execute a live query to ensure it works as expected.
- Verification:
- Check the output to confirm that it accurately lists all installed extensions.
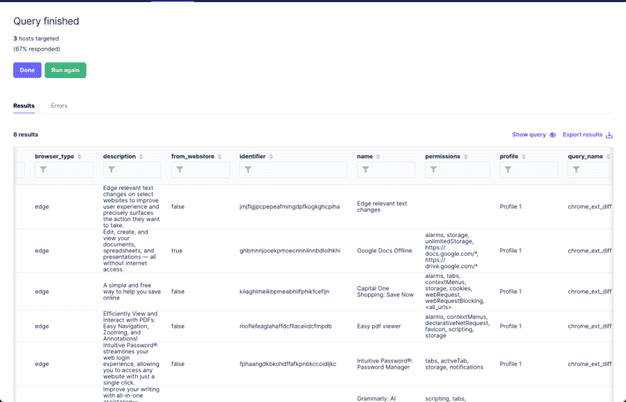
- Schedule the Query:
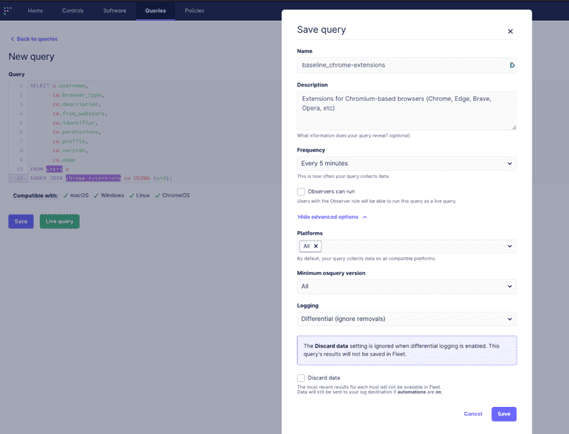
- Set the query to run every 5 minutes.
- Configure it to log the results in differential mode, meaning only newly installed extensions will be sent after the initial query completes.
- Log Results to Elasticsearch:
- Ensure the query results are logged to Elasticsearch for further analysis.
Viewing the Osquery Overview dashboard in Kibana, we can see the logs that have been generated by our scheduled query (along with logs from other scheduled queries).
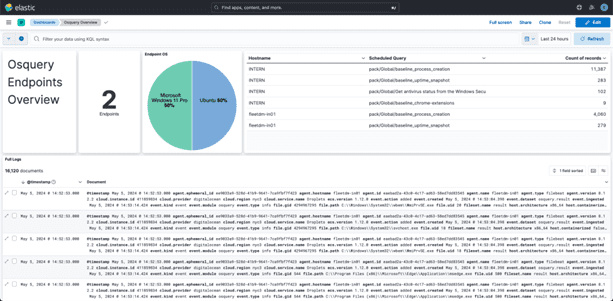
The dashboard offers a useful overview of data generated by osquery, but we want to home in high-risk browser extensions. Let’s build out a detection in Elastic Security to alert any time a browser extension is installed that matches some keywords: “password” for now.
Building a Detection Rule:
- Focus on high-risk browser extensions by building a detection rule in Elastic Security.
- Detection Rule Criteria:
- Generate an alert any time a browser extension is installed that matches certain keywords, such as “password.”
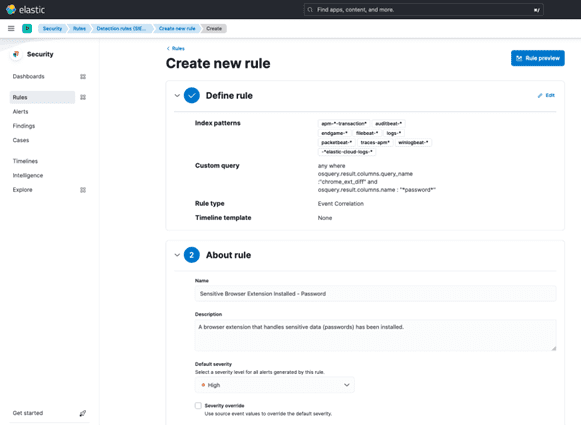
Finally, let’s verify the detection works by installing a new password-related browser extension and confirm that we see an alert generated:
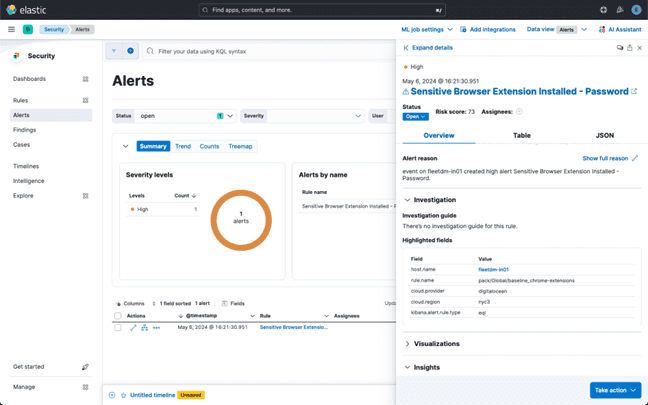
Testing the Detection:
- Verify that the detection rule works by installing a new password-related browser extension.
- Confirmation:
- Ensure that an alert is generated and logged appropriately.
Alternatives, Resources, and Next Steps
As mentioned above, we do not endorse specific tools for your workflow. Similar results can be obtained with other related projects. ElasticStack itself contains an osquery manager. Similarly, Security Onion could be used with Elastic Agent. Here are some resources to explore these possibilities
- Security Onion main site
- Free training: Security Onion Essentials
- Video walkthrough of Elastic Agent install on Security Onion
Many online resources, guides, and courses are available to learn related skills:
- Guidance on using osquery to monitor persistence mechanisms on Linux
- Part 2: Making use of FleetDM with Logging
This post was written by Josh Brower with contributions from Neil Blazevic, Martijn Grooten, Joey Salazar, Marc Shaffer, and Ashley Fowler.